GRIT 모니터링 구성: Prometheus + Loki + Grafana + Spring Actuator
GRIT 모니터링 구성: Prometheus + Loki + Grafana + Spring Actuator
목적
GRIT 프로젝트를 진행하면서 기능을 붙이다 보니, 어느 순간부터는 운영 관점에서 확인할 지점이 늘어났다. 문제가 생겼을 때 경험에 의존하기보다는, 숫자와 로그로 확인할 수 있는 형태가 필요했다.
- 서비스 상태를 수치로 확인할 수 있는 상태
- 장애나 이슈가 났을 때 로그를 빠르게 모아 볼 수 있는 상태
그래서 메트릭은 Prometheus, 로그는 Loki, 대시는 Grafana로 구성했다. Spring 애플리케이션은 Actuator와 Micrometer로 메트릭을 노출하고, Logback에서 Loki로 로그를 보냈다.
프로젝트 스택은 Spring Boot 4.0.1, Java 25, PostgreSQL이다.
전체 구성
- Prometheus: Spring 애플리케이션과 LiveKit 메트릭을 함께 수집
- Loki: Spring 로그를 배치로 수집
- Grafana: 대시보드와 탐색
- 배포/운영: docker-compose로 Prometheus, Loki, Grafana 구동
Spring 애플리케이션 설정
의존성(build.gradle)
1
2
3
implementation 'org.springframework.boot:spring-boot-starter-actuator'
implementation 'io.micrometer:micrometer-registry-prometheus'
implementation 'com.github.loki4j:loki-logback-appender:2.0.3'
Actuator 노출(application.properties)
1
2
management.endpoints.web.exposure.include=prometheus,health,info
management.metrics.tags.application=grit
/actuator/prometheus엔드포인트를 노출한다- 모든 메트릭에
application=grit태그를 추가한다
Loki 전송(logback-spring.xml)
아래 설정으로 Logback에서 Loki로 로그를 전송했다.
- 라벨을 붙여서 Grafana에서 필터링이 쉬워지게 한다
- traceId, spanId를 함께 남겨서 추후 분산 추적(OpenTelemetry)으로 확장할 때 연결할 수 있게 했다
- 5초 또는 500건 단위로 배치 전송해서 전송 부하를 완화했다
1
2
3
4
5
6
7
8
9
10
11
12
13
14
15
16
17
18
19
20
21
22
23
24
25
26
<configuration>
  <appender name="LOKI" class="com.github.loki4j.logback.Loki4jAppender">
    <labels>
      service = grit
      application = grit
      app = grit
      level = %level
    </labels>
    <message>
      <pattern>%d{yyyy-MM-dd} %d{HH:mm:ss.SSS} trace_id=%X{traceId:-NONE} span_id=%X{spanId:-NONE}
        trace_flags=%X{traceFlags:-NONE} %-5level [%thread] --- %logger{36} - %msg%n
      </pattern>
    </message>
    <http>
      <url>http://LOKI_HOST:3101/loki/api/v1/push</url>
    </http>
    <batch>
      <maxItems>500</maxItems>
      <timeoutMs>5000</timeoutMs>
    </batch>
  </appender>

  <root level="INFO">
    <appender-ref ref="LOKI"/>
  </root>
</configuration>
Prometheus 설정
Spring 애플리케이션 메트릭은 /actuator/prometheus, LiveKit은 /metrics로 수집했다.
1
2
3
4
5
6
7
8
9
10
11
12
13
14
15
global:
  scrape_interval: 15s

scrape_configs:
  - job_name: "livekit"
    metrics_path: /metrics
    static_configs:
      - targets:
          - "APP_HOST:6789"

  - job_name: "spring-app"
    metrics_path: /actuator/prometheus
    static_configs:
      - targets:
          - "APP_HOST:8080"
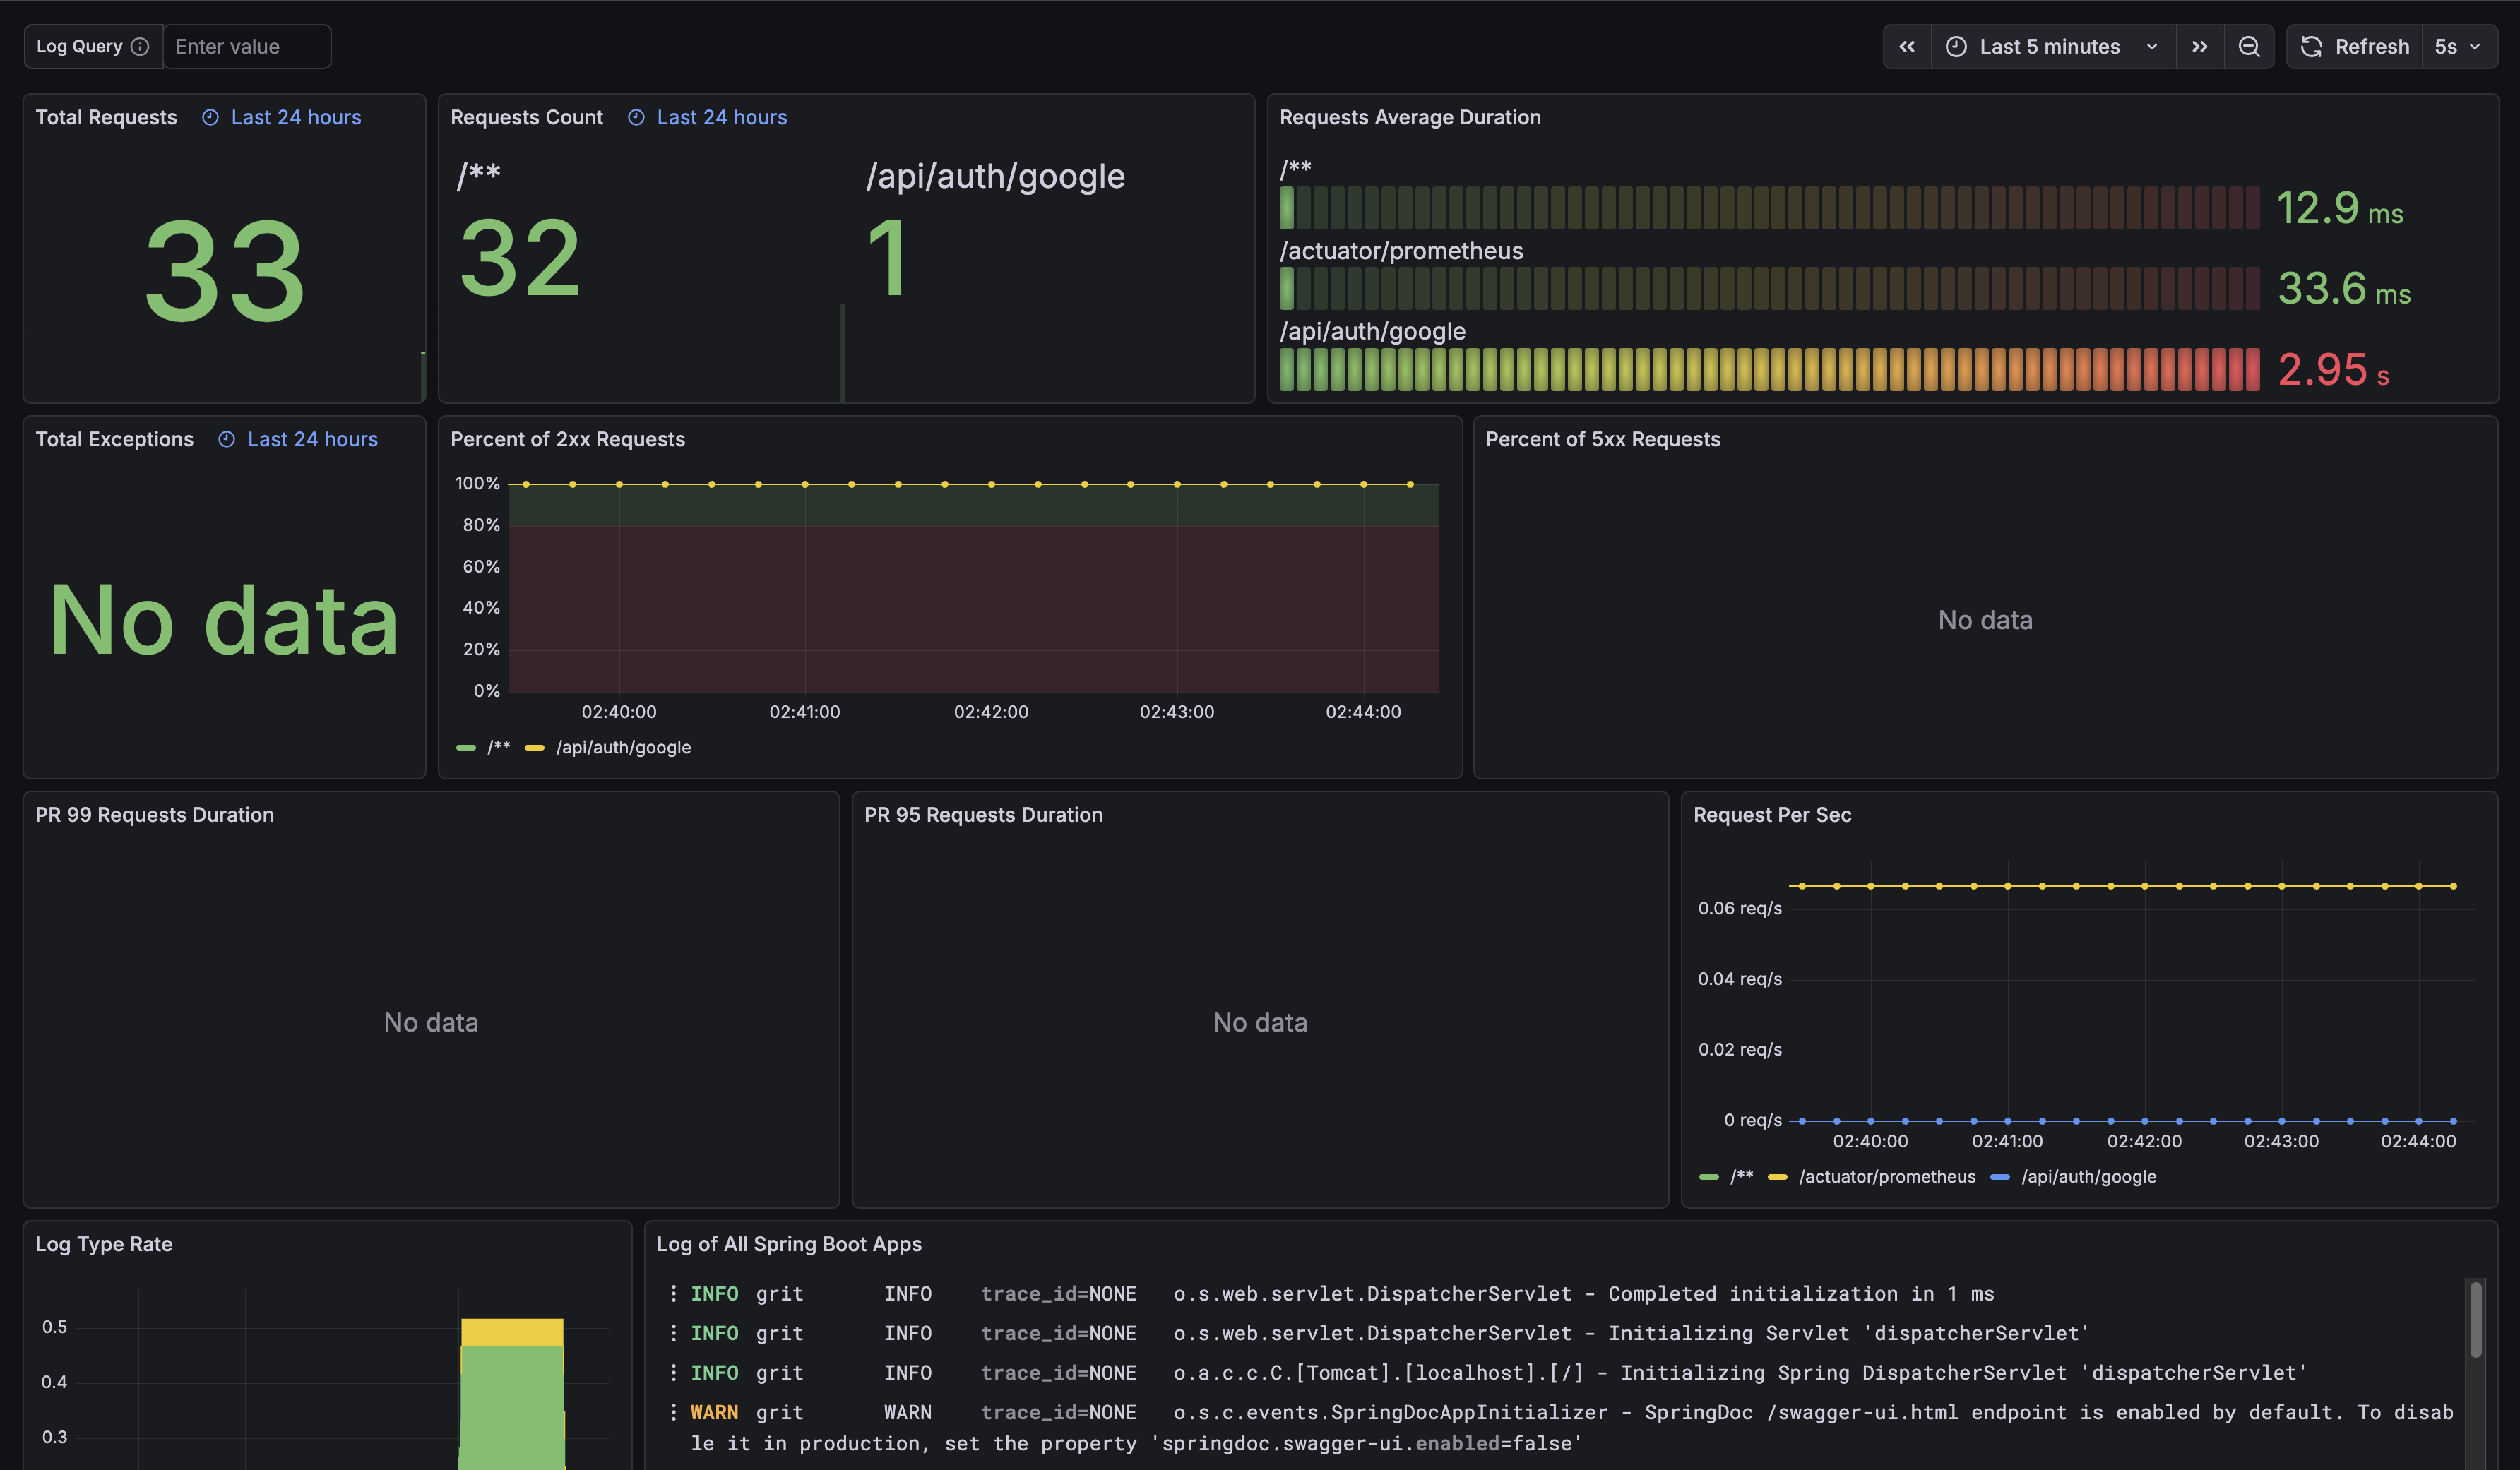
대시보드 스크린샷(메트릭)
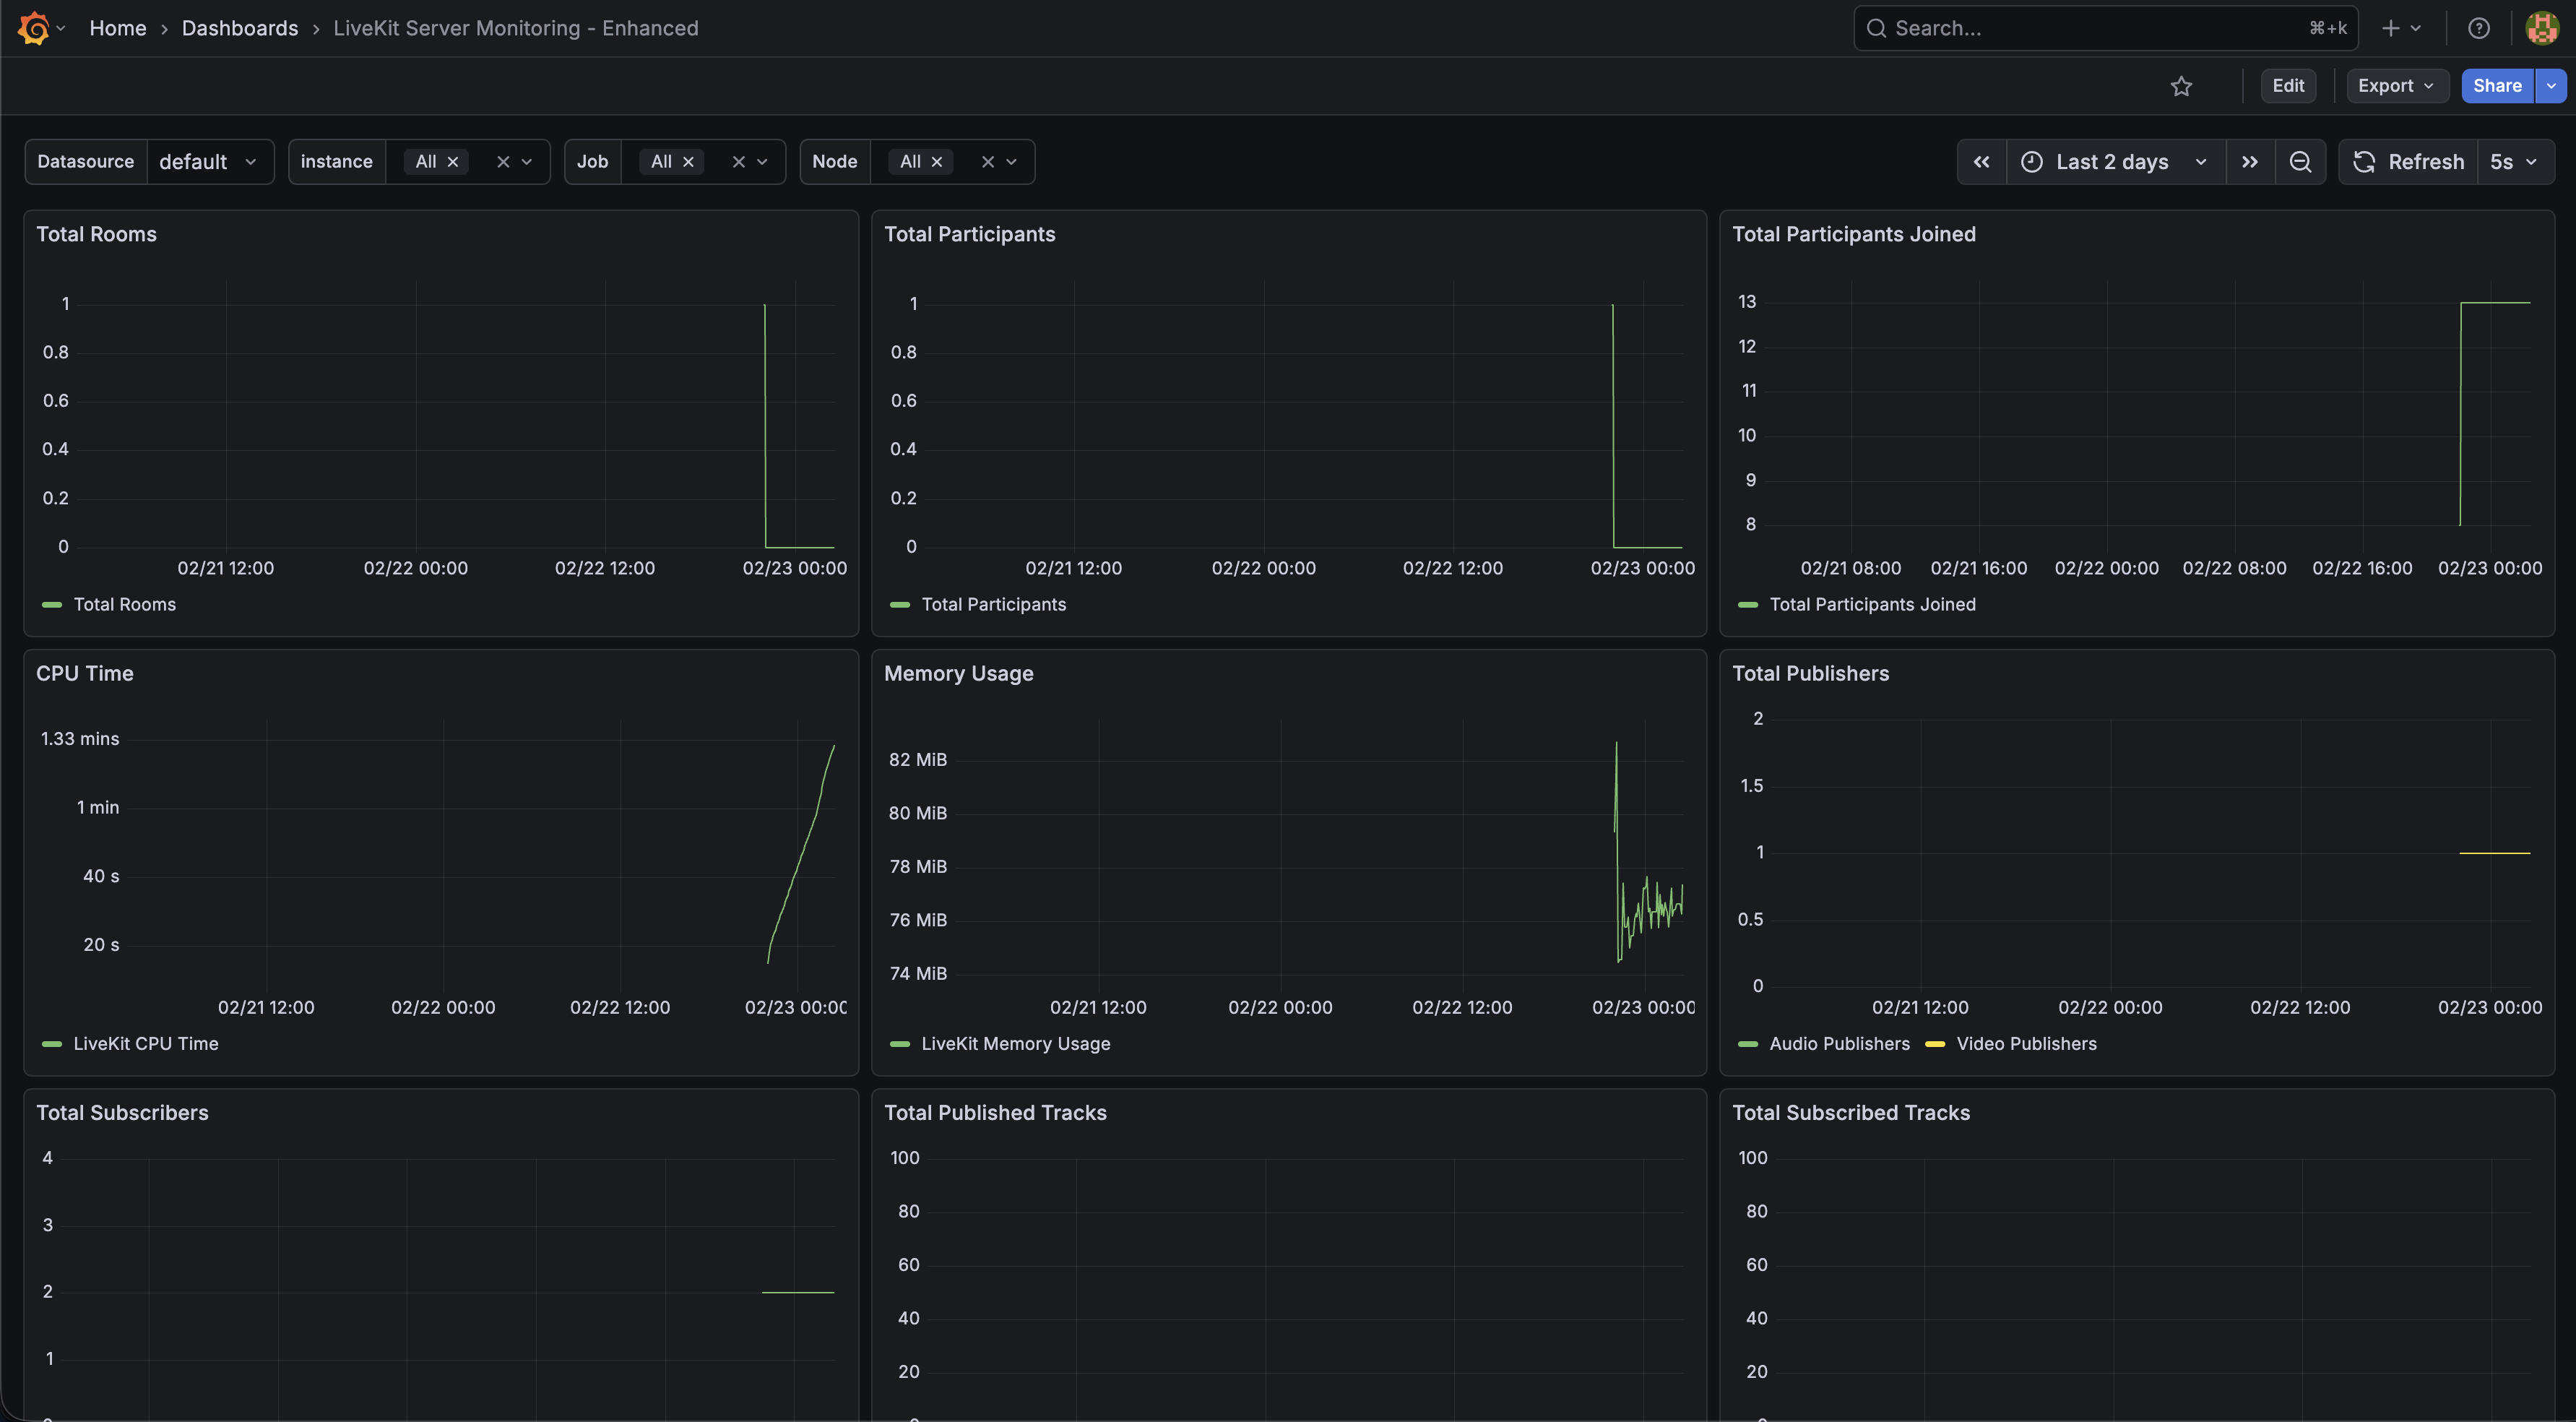
Spring Boot와 LiveKit은 같은 Prometheus에서 수집하고, Grafana에서 각각 대시보드로 확인했다.
Spring Boot
LiveKit
정리
- Spring 애플리케이션과 LiveKit 메트릭을 한 Prometheus에서 수집해 한 대시보드에서 같이 확인할 수 있도록 구성했다
- 로그에는 traceId, spanId를 남겨서 추후 분산 추적 연동을 고려했다
- Loki 전송은 배치로 설정해 로그 전송 부담을 낮췄다
프로젝트: GRIT 관련 링크
- GitHub: Don-zo/GRIT
이 기사는 저작권자의 CC BY 4.0 라이센스를 따릅니다.